Monitoring resource utilization during performance testing is crucial. This helps ensure that your system can handle the anticipated load. In this post, we'll explore CPU and memory utilization in performance testing. We'll also offer some tips on getting started. With enough information regarding resource utilization, you'll be able to understand your system's capabilities. And also identify potential performance bottlenecks.
INDEX
What is Performance Testing?
What is Resource Utilization?
What are some common utilization performance testing metrics to monitor?
CPU Utilization (Is there a doctor in the house?)
Memory
Find a Memory Leak formula:
Disk Bottlenecks
How to Find a Disk bottleneck formula:
Network Bottleneck
How to collect all this performance testing data?
Performance Testing Start small
What is Performance Testing?
Performance testing is a crucial part of software development. It exercises your system to see if there are any problems with its response time, stability, etc., in a production environment. This helps identify potential crashes when the program is put under extreme conditions. That way, they can be fixed before things go wrong.
Comprehensive testing helps software developers analyze how long it takes for an end-user to execute certain tasks and interact with the interface. This information helps create versions of a system that satisfy these requirements.
What is Resource Utilization?
In addition to throughput and response times, another key performance indicator of an application's performance is often referred to as utilization.
Resource utilization is a way to track how busy various resources of a computer system are when running a performance test.
(FYI: I originally wrote this article in 2011, but the principles I cover are timeless and still apply)
What are some common utilization performance metrics to monitor?
There are tons of metric counters to choose from to help monitor utilization. When I'm running a performance test, however, these are the four key areas that I begin with:
- CPU
- Memory
- Disk
- Network
CPU Utilization (Is there a doctor in the house?)
CPU utilization measurements can help determine how effective your test is. It can also be used as a gauge of how any tuning change you've made has affected the overall performance of the system. I like to think of the CPU as the pulse rate in the overall health of a system.
CPU bottlenecks come in two forms:
- when the processor runs at over 80% of its capacity for an extended period
- you have too many things queued up
When the CPU hits 100% it can no longer process more work and your throughput flattens. Usually, a best practice would be to avoid 80% CPU utilization for each processor for long periods of time.
You'll want to try and grab CPU utilization for all servers used in your application under test (AUT) infrastructure. CPU is a quick and easy key metric because it can rapidly help you identify which servers may be causing issues or creating potential bottlenecks. To take a look at CPU utilization:
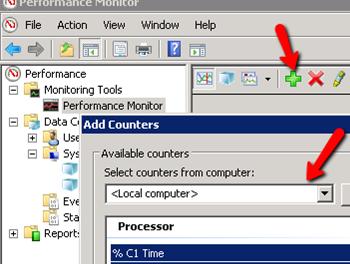
- On a Windows machine, go to Start>Run and type perfmon:

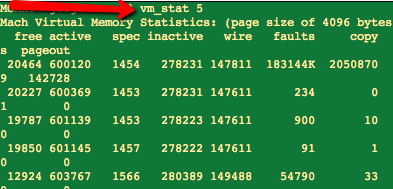
- On a UNIX machine you could use vmstat 5 or on mac from the terminal type vm_stat 5:

CPU bottlenecks can be solved by running a simple test on your computer. When the CPU is bottlenecked, adding more memory and optimizing software coding will increase its power to solve problems faster than before.
Memory
This counter can help find potential memory leaks caused by your application. Based on Microsoft's recommendations in Performance Testing Microsoft .NET Web Applications, memory leaks can be found by monitoring:
- Memory\Available bytes
- Process\Private Bytes
- Process\Working Sets
The memory bottleneck means that there isn't enough RAM to go around. This situation cuts down on the speed at which information flows from your computer's modules into its processor unit. And this can result to slow overall operations.
Memory is the lifeblood of your system. With insufficient memory, everything from startup time to program execution will suffer. Data won't be stored or processed quickly by CPUs, especially when working with programs that rely heavily on internal storage or RAM.
Resolve the issue by installing higher capacity and/or faster RAM. In cases where existing memory is too slow, it needs to be replaced with newer models that have increased processing speeds for quicker results when searching through large amounts of data or analyzing complex problems.
Find a Memory Leak formula:
A Memory leak will usually show Process\Private Bytes and Process\Working Sets increasing, and Memory\Available bytes decreasing.
Disk Bottlenecks
Although when you hear the word “Disk,” the first thing that most likely comes to mind is disk space, disk bottlenecks are usually related to time.
Long-term storage is often an unavoidable computer bottleneck. Even the fastest solutions have physical speed limits that are hard to troubleshoot.
Some counters to help troubleshoot disk issues are:
- Average Disk Queue Length
- Average Disk Read Queue Length
- Average Disk Write Queue Length
- Average Disk sec/Read
- Average Disk sec/Transfer
- Disk Reads/sec
- Disk Writes/sec
There are a number of ways you can improve your disk usage speed. For instance, reduce fragmentation issues and increase data caching rates in RAM. On the physical level, address insufficient bandwidth with faster storage devices. Or expand RAID configurations to increase speeds for reads/writes on mechanical hard drives.
How to Find a Disk bottleneck formula:
I/Os per Disk = [Read + (4xWrites)] / Number of Disk
(To see a step-by-step example of how to use this formula, take a look at pg. 84 & 85 of the Microsoft book I mentioned earlier)
Network Bottleneck
The last resource utilization metric to keep an eye on is the network. This may be even more important nowadays, with the growth of distributed app running in the cloud. Things to keep an eye on are:
- Network latency – The time it takes to send a data packet across a network connection
- Network Round Trip – a client-server request and response generated by your application
- Data transfer – The amount of info moved from a browser to a web server.
Lots of data combined with restricted bandwidth and network latency usually equals stinky performance. It's kind of like expecting Superman to save the world in a straight jacket and a pocket full of kryptonite. (Well, maybe not quite that bad.)
Network bottlenecks can be frustrating, especially if you're trying to get a task done quickly. Networking issues most often arise from an overload of the server or device. It may also result from networks losing their integrity. That is why it's important that these problems are resolved immediately so they don't worsen.
The best way forward might involve upgrading hardware. For instance, use servers with more processing power (or add another one). Also, change your router settings accordingly. That way all connected devices have access without getting stuck.
How to collect all this performance testing data?
Measuring the performance of an application allows you to determine if the system is ready for production. How and when will vary according to what priorities are set out in the test plan.
Measurability is important because it helps us assess your progress. But also makes sure that you’re not spending time on something unimportant. For instance, getting better at coding without having to measure user experience first would be throwing away valuable feedback from both sides.
Instead of writing performance data to a bunch of text files, most performance tools have the ability to gather most of these metrics in a single location.
Performance Testing Start Small
Performance monitoring is a big topic. I believe in starting small and then slowly adding more complexity.
Here are some of the performance testing best practices to always remember:
- Load testing should be done early in the development process. This will help avoid pitfalls. This also ensures that your application functions as expected.
- Performance testing is important for both successful projects and individual modules or units.
- For the best results, conduct multiple performance tests and take averages.
- Involve IT, testers, and developers in creating a testing environment.
- Baseline performance benchmarks provide a starting point for determining success or failure.
- Look beyond the usual performance metrics or test parameters.
- The performance test environment should be isolated from the quality assurance testing one. This will help avoid possible distractions. Most importantly, this ensures that only qualified workers are performing tests.
- The consistency of your testing environment is vital to the success of any project.
- When preparing reports that share system performance testing findings, consider the audience. Additionally, include any system and software changes in your report.
There are many other performance counters to choose from.
Hopefully, these four areas — CPU, MEMORY, DISK, and NETWORK will help get you started.


