As we head into the holiday season, the topic of front-end performance testing of consumer-facing businesses like retailers, publishers, and financial companies will become even more critical.
Also, I'm sure most folks probably aren’t even planning for how to handle higher traffic than normal on their site in this Covid-19 world we’re living in.
This can be frustrating.
Our teams might have initially put a lot of effort into making our sites fast, but one of the challenges you’re probably facing is how to stay on top of things once you've released your application into the wild.
I speak with many developers and testers who struggle with things like how to monitor their site speed over time, and how to know what a new release’s code changes will have on front-end performance.
So, I've taken the best advice I could find from performance experts like Andy Davies, author of Using WebPageTest: Web Performance Testing for Novices and Power Users and a past Performance Guild speaker, into this resource for you.
You'll discover some ways to address the front-end performance challenges you and your team are probably facing.
Read on to learn:
- The psychology of response times
- What front-end performance is and why it matters.
- Ways to measure your application’s client-side performance
- A look at some free tools and commercial alternatives
- An example of a workflow your developers can follow
The Psychology of Web Page Response Times
Let's start with a little bit of human psychology.
Download Andy's Free Front-end Performance Master Class Video
Get Andys masterclass video on Adding Front-End Performance to the Testing Lifecycle. In this session, Andy explores some of the critical aspects of site speed, why they matter, and how we can measure them. He'll then go on to demonstrate how we can automate their testing and incorporate it into our software lifecycle.
Imagine stepping back almost 50 years to 1968, when Bob Miller was researching how we respond to delay.
He found that as long as you receive a response within a tenth of a second of an action, you’ll see that as instant, and if you press a button and a light comes on in a hundred milliseconds, you’ll perceive that as instant.
As the delay creeps up around a third of a second, you’ll begin to notice the light. If you receive a response within a second, you can seamlessly carry on, and it doesn't interrupt your flow.
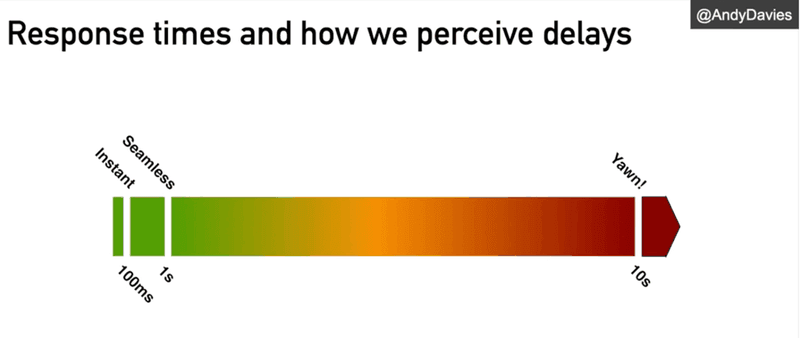
But the longer that delay becomes, the more likely we are to bounce.
In 1968, they found the limit was around ten seconds.
A few years ago, Microsoft did similar research and found the limit was more than the seven or eight-second mark.
Why Application Front End Performance Response Times Matter?
Because of money!
If you make people wait on your website, if you deliver a slow experience, it will have fundamentally negative implications for your business.
We can see this when we look at real data of the experiences people get on websites, and how that influences their behavior.
This is a chart taken from a product that measures real business experiences and tracks a bit about their behavior:
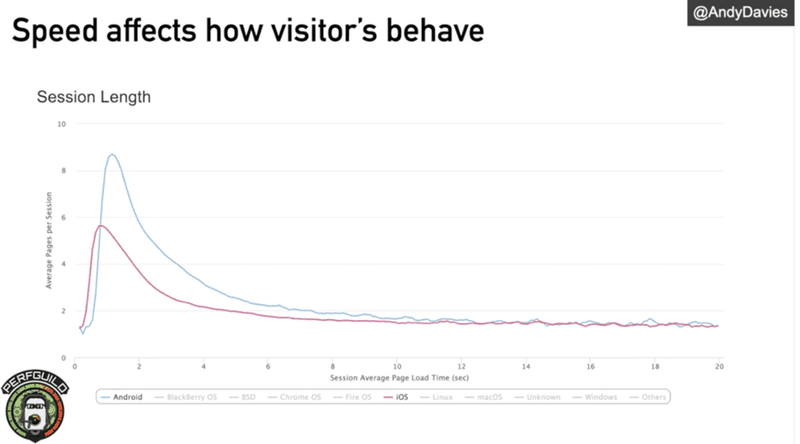
As you can see from the chart, people with fast experiences view more pages on a website.
If you work for a retailer, that means they look at more products, which probably leads to more sales!
If you work for a publisher that relies on advertising, it means they read more stories.
And the impact of speed on peoples’ behavior also affects how fundamentally successful our sites are.
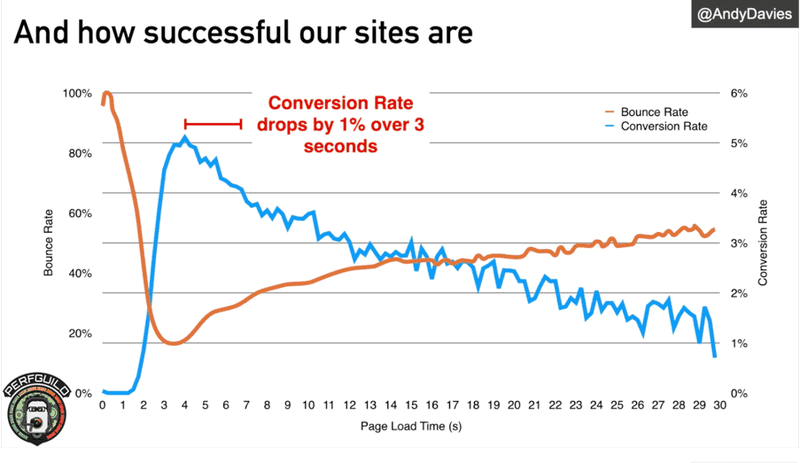
The orange line in the chart above represents the bounce rate.
What is a bounce rate? It represents how many people come to your site, visit one page, and then leave. A high bounce rate means folks are leaving your site without taking any action.
Not good.
You can see the bounce rate is lowest at the three-second mark, then climbs after that.
The longer you make people wait, the more likely they are to only visit one page.
The blue line shows the conversion rate.
The conversion rate is how many people spent money and bought things.
As you can see, virtually nobody converts below three seconds; probably because very few pages complete before three seconds.
The longer we make someone wait, the less likely they are to convert.
And in that four-to-seven-second mark, our conversion rate drops from five to four percent.
That translates into a lot of lost revenue. :(
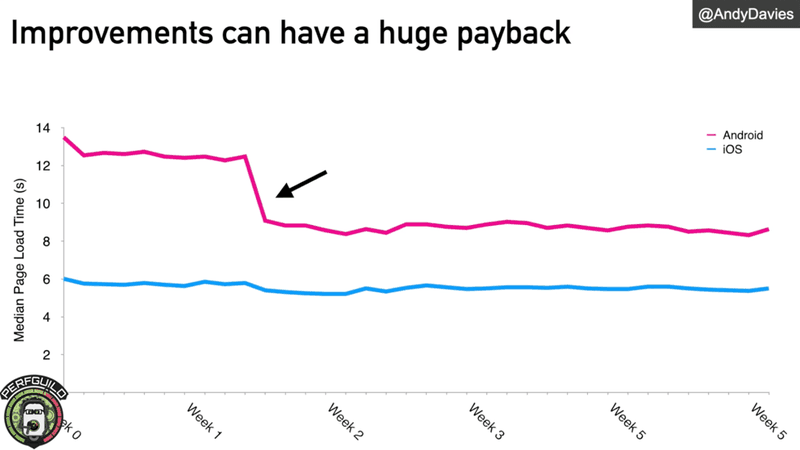
The chart above is an example of an instance in which Andy helped a retailer improve their site's speed.
They were targeting Android-only users up to that point, and he made some changes that improved the median experience for those Android visitors by four seconds.
After making that one small change, they saw the amount of revenue from those visitors increase by 26%!
Why you need to focus on more than just your backend performance
Your team probably spends a considerable amount of money on building and tuning server farms and databases and testing their capacity to ensure your firm can serve that initial HTML payload really quickly to your site visitors.
The following are some examples of various UK sites.
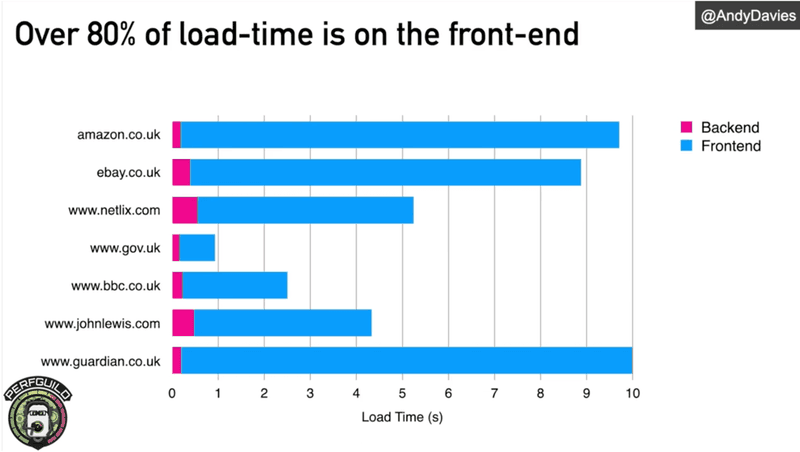
The pink band shows how long it took the backend to generate the initial response.
The blue represents all the other resources—images, scripts, stylesheets; all the things we need to complete the payload.
When focusing on performance, it's essential not to ignore the backend, because until the backend has delivered a response, there is no work for the front end.
But the majority of the work that's affecting this experience is actually happening in the browser.
If you’re going to measure front end performance insight, you need a mental model that helps you understand how the metrics you gather map to the actual business experience.
The model below is the one we often use.
Mental Model for Software User Experience
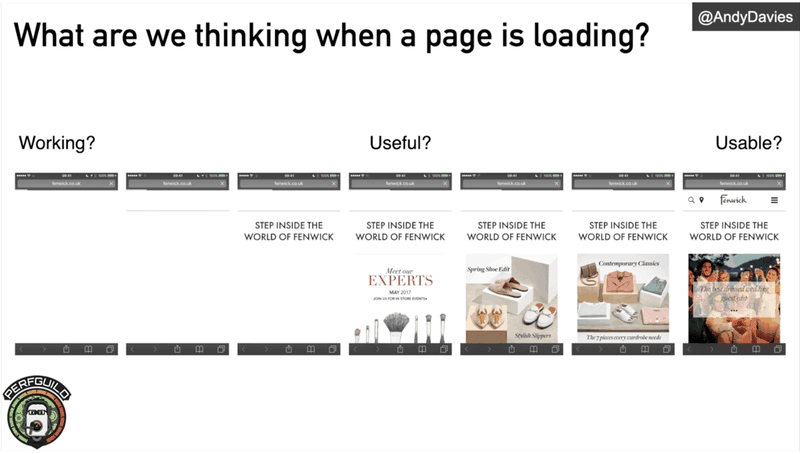
The image above represents the visual clues a visitor might have that things are working properly.
In this case, we can see the browser bar has changed the address of the website, but at what point does the page actually become useful? Is it in this case, when the hero image appears in the middle?
It's different for different sites.
For a new site, it might be when somebody can start to read the news.
It also could be when the product image appears, and the visitor can see that they're on the right page for a retailer.
We then have to consider: at what point does the page become usable? In this example, it's pretty late because the menu button is not immediately available.
So when we're thinking about front-end performance, we're thinking about how long the page takes to load before it becomes useful?
How long does it take to become usable, and what's happening in the beginning phase? There are two broad ways of measuring how pages perform.
How to Measure How Your Front-End Pages Performance
There are two main ways you can go about measuring your applications front end performance and that is:
- Synthetic – in lab-style environments where we have defined test setups in known conditions
- In the Wild – in real people's browsers, using whatever phone they're using, connected to whatever network they're using
Both of these approaches have their place.
This post focuses on the lab approach because that's the one that most closely fits with how we build performance into our initial workflow.
Read here for a list of some free application performance monitoring (APM) tools you should also check out.
Where to start thinking about front end performance?
If you do nothing else, the critical takeaway is to start building performance into your SDLC. As early as possible is essential!
These are some of the situations during which you should be thinking about performance:
- When you're still in the planning phase, thinking about how big your pages will be and what they will be composed of
- When you're running a test on each build to understand whether the build has made the site faster or slower
- When you’re tracking your releases, and probably using an external APM tool to understand how your performance is changing now that you've released that software
- When checking your release(s) using synthetic and real-user-experience monitoring tools to understand what folks are experiencing in the wild, and then using that info to respond and adjust
If you decide that your application will include lots of fonts, scripts, and images when you release it into the wild, and you discover that your users are experiencing slow response times, you should revise those choices and slim your site down.
Integrating performance into your continuous integration (CI) / continuous delivery pipelines is a must to test against your performance KPIs to ensure that you’re delivering a good performant experience to your users.
So, how can you start building performance into your SDLC?
At this point, you may be asking, “How should I begin building performance engineering into my development workflow?”
First, let's look at a few tools you can use to test performance in a synthetic, lab-type environment.
You'll then see how to incorporate these tools into your CI/CD process so you can, on every check-in, understand whether they’re having a positive or negative impact on performance.
Introducing Google Lighthouse
The first tool you’re going to want to use is Google Lighthouse.
Chrome DevTools has Lighthouse built into it, so if you have Chrome installed, you can start experimenting straight away and explore the features it offers.
When you open DevTools, you should see an option for Lighthouse (FYI: It used to be called the Audit panel).
When you start Lighthouse, it will begin examining the page’s, performance, accessibility, and SEO best practices.
You can also choose to have a test page in a mobile scenario where it uses an emulated mobile device that has a smaller screen size, a slowed-down C.P.U., and a slower network. Or, you can test on a desktop device.
Reuse Your Existing Automation Tests
Another way to incorporate Google Lighthouse into your development process is to leverage your existing automation tests to capture this data.
There are many tools that can do this; one that comes immediately to mind is Cypress.io.
Cypress.io has a Cypress-audit plugin that allows you to use Lighthouse.
Now that’s cool!
What’s Your Performance Number?
Let's use the UK version of Amazon as a test site to try out Lighthouse’s features.
When Lighthouse is done auditing your site, it will generate a report that looks like the following:
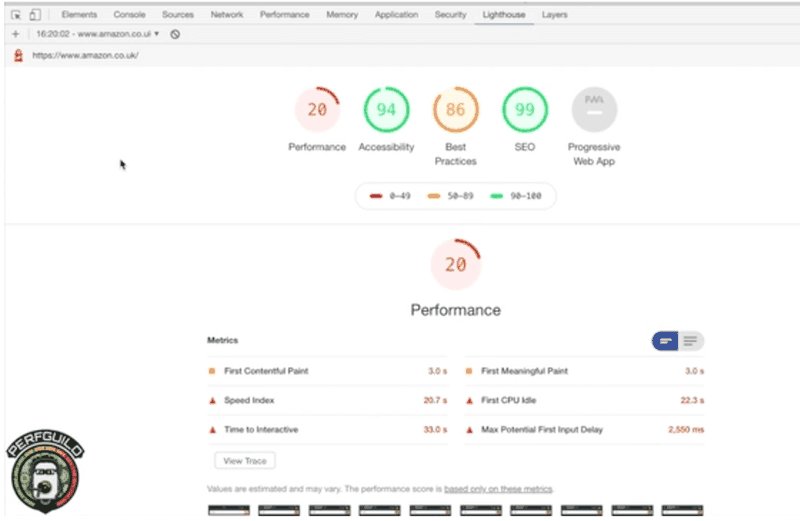
The performance score (20) in this example isn't great, but it’s good to receive a metric that can be tracked over time; this can be useful when discussing performance with your company stakeholders.
You can also simply use it as a measure over time as to whether you’re getting better or worse, or as a comparison with your competitors.
Once you have your number, you can start focusing on how to improve it.
Other Google Lighthouse Features
Besides the main performance score, there are other metrics to do with the experience a visitor might have when a page is loaded.
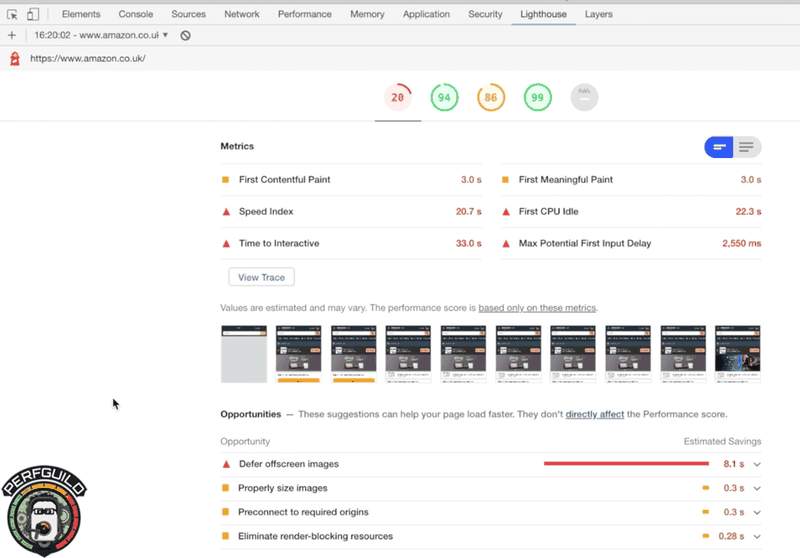
- First Contentful Paint—when did content start to get painted to the screen?
- Speed Index—measures how long it takes for the visitor screen to go from blank to being fully complete and stable. The faster the better when it comes to the experience your users receive.
- Time to Interactive—tries to measure when a visitor can start interacting with your application by being able to click, scroll, or enter text into a text box.
These metrics help you to judge the visitor's experience.
So, the total “Performance” score you see in the report is a great high-level metric that you can use to track your relative performance over time.
If you want to go deeper, you can use some of these lower-level metrics to track and see where you may be getting better or worse.
Lighthouse also generates some suggestions on things you could be doing better. .
Then, in the diagnostics, you can see some of the reasons why you receive the score you did.
Overall, Lighthouse gives you a top-level metric to track, and sub metrics you can use to understand how to make your page faster.
Download Andy's Free Front-end Performance Master Class Video
Get Andys masterclass video on Adding Front-End Performance to the Testing Lifecycle. In this session, Andy explores some of the critical aspects of site speed, why they matter, and how we can measure them. He'll then go on to demonstrate how we can automate their testing and incorporate it into our software lifecycle.
Another popular tool you can use that utilizes Lighthouse behind the scenes is PageSpeed Insights.
DebugBear
There are some cost-effective, commercial tools out there that can help you track a Lighthouse score over time.
One of them is DebugBear, which will run Lighthouse on a web page or set of web pages you provide regularly and produce dashboards that look like this:
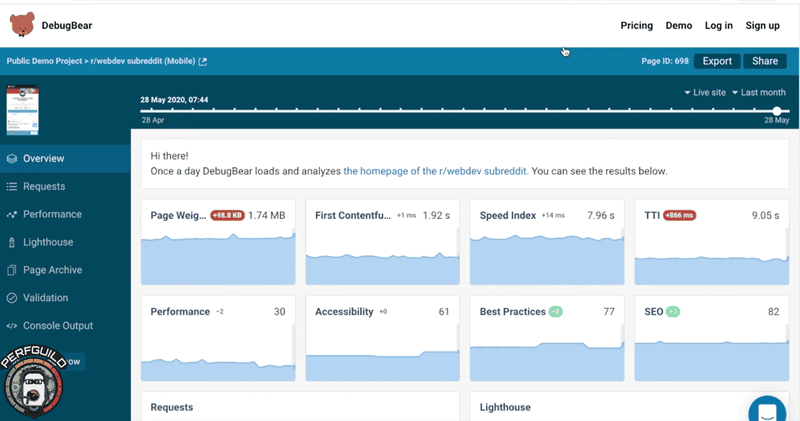
This makes it easy to see how all your key, front-end performance metrics are changing over time.
Treo
Treo is another product that can create Lighthouse dashboards for you, as well as track performance over time.
Treo gives you a snapshot of the scores, timings from the latest test, and the main score. You can then scroll over and see how it’s changing over time.
These tools can help you leverage Lighthouse not only to make a snapshot but to be used as part of your SDLC to track how your performance is changing over time.
WebPageTest
WebPageTest is often referred to as the Swiss army knife of performance testing tools.
It uses real browsers, not just Chrome as Lighthouse, but you can test in Firefox, Edge, Chrome, and other browsers. You can also test on real mobile devices.
Similar to Lighthouse, you can basically test through multiple locations around the world, whereas WebPageTest has four areas, and DebugBear and Treo have about10 or 13 each.
When you run a test from WebPageTest you have lots of options—including Capture Video, which is handy.
After the test is complete, it generates a report like this:
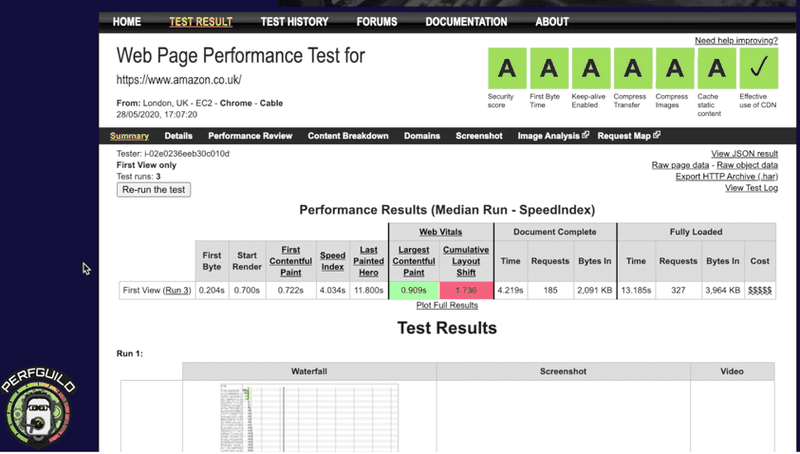
You receive a set of metrics about the page that are a slightly lower level of detail than Lighthouse.
One of the first things Andy looks at in this report is the video film strip view of the page:
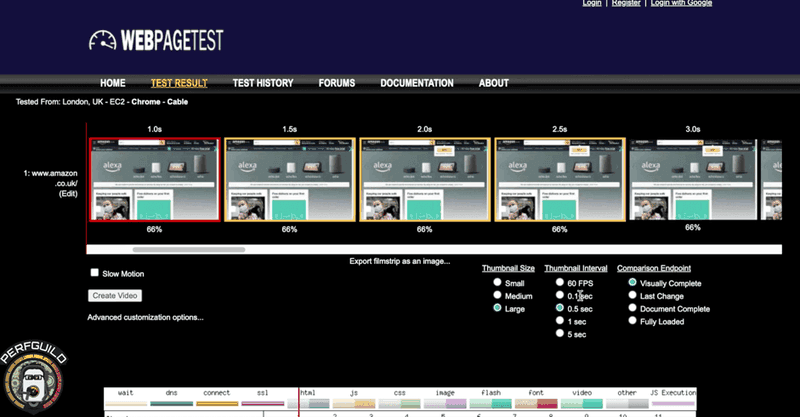
This view is extremely effective for showing key performance areas because everybody understands a filmstrip.
It builds empathy about what the visitor's experience is really like.
WebPageTest gives you a richer, wider set of metrics than Lighthouse.
It also affords you the ability to drill down in those tests to glean more information and actually understand why you got the results you did.
Similar to there being commercial variants of Lighthouse, there are also commercial equivalents of WebPageTest.
SpeedCurve and Calibre
SpeedCurve uses the same engine as WebPageTest under its hood and also tracks performance over time.
You can set it up to track hourly or daily.
Another product that's not built into the WebPageTest but does something similar is Calibre.
Both SpeedCurve and Calibre will help you track your site's performance, whether that's in a staging environment or a real, live environment over time.
The Power of APIs in your CI/CD
Andy mentioned that he wanted to introduce DebugBear, Treo, SpeedCurve, and Calibre because they all have APIs.
When a product has an API that allows you to start testing or invoke a test on-demand and get the results back when it completes, it means you can begin to integrate it into your build processes and development lifecycle.
As you make changes, you can track how those changes are affecting your scores in Lighthouse, or your absolute raw timings in WebPageTest, SpeedCurve, and Calibre.
Another thing I should mention is that SpeedCurve and Calibre both have the ability to track performance over time, as they both have Lighthouse incorporated into them.
Think of them as one step up from the DebugBear and Treo-type products.
You may be wondering why you should use vendor-paid solutions when you can get by just fine with open source.
Andy has found that it’s critical to get these insights as part of your team’s CI/CD pipeline. The paid solutions allow you to access this functionality.
Building front-end performance testing into a continuous integration cycle is, in his experience, the best way for his clients to stick to good performance practices.
To view some demos of Andy showing how to integrate with CI/CD tools like GitHub, be sure to register to get his session video and live Q&A here.
Advice on how to get started with Front End Performance Engineering
At the beginning of this post, I mentioned that Andy made a massive improvement to the user- response time in the Android retail example, but it's not always that simple.
We often make a series of small, incremental gains that eventually add up to larger ones.
The same is true for building front-end performance into your workflows.
Start simple—perhaps with PageSpeed Insights, Lighthouse, or one of the commercial services.
Set some limits around where you are currently, and use them to make sure things aren't getting worse when you make changes. Then, over time, start working on more advanced speed improvements.
Remember: Google is planning to start using performance as one of the ranking factors in its search algorithm—which means that soon the rest of your business is going to become interested in front-end performance as well.
Download Andy's Free Front-end Performance Master Class Video
Get Andys masterclass video on Adding Front-End Performance to the Testing Lifecycle. In this session, Andy explores some of the critical aspects of site speed, why they matter, and how we can measure them. He'll then go on to demonstrate how we can automate their testing and incorporate it into our software lifecycle.

